Jay Snyder
VP, Client Services

Marketing dashboards are at once a source of frustration and salvation for brands and agencies. Marketers rely on dashboards for daily intelligence on campaign performance, but can find offloading the data of a dashboard into monthly reports a struggle. That’s not the only barrier preventing effective reporting.
Marketers also can struggle to develop a presentation format for their report that communicates a story with the data.
By aligning marketing reporting content with marketing performance context, marketers can create dashboards and presentations that meaningfully connect with stakeholders. The classic metaphor of the marketing funnel can provide this context.
Here are five marketing dashboard examples that relate to the typical Awareness, Consideration, and Decision stages of the marketing funnel.
Because of its simple design and functionality as a strategic framework, the Marketing Funnel is one of most enduring metaphors in business culture.
Buyers on a path to purchase your product or service travel through three stages along that journey: Awareness of your brand; Consideration of your brand; and then finally the Decision to purchase.
While a customer’s actual path to purchase a brand may be more circuitous, and attribution models in digital marketing for measuring success more complex, the funnel helps simplify strategy and can bring context to reports.
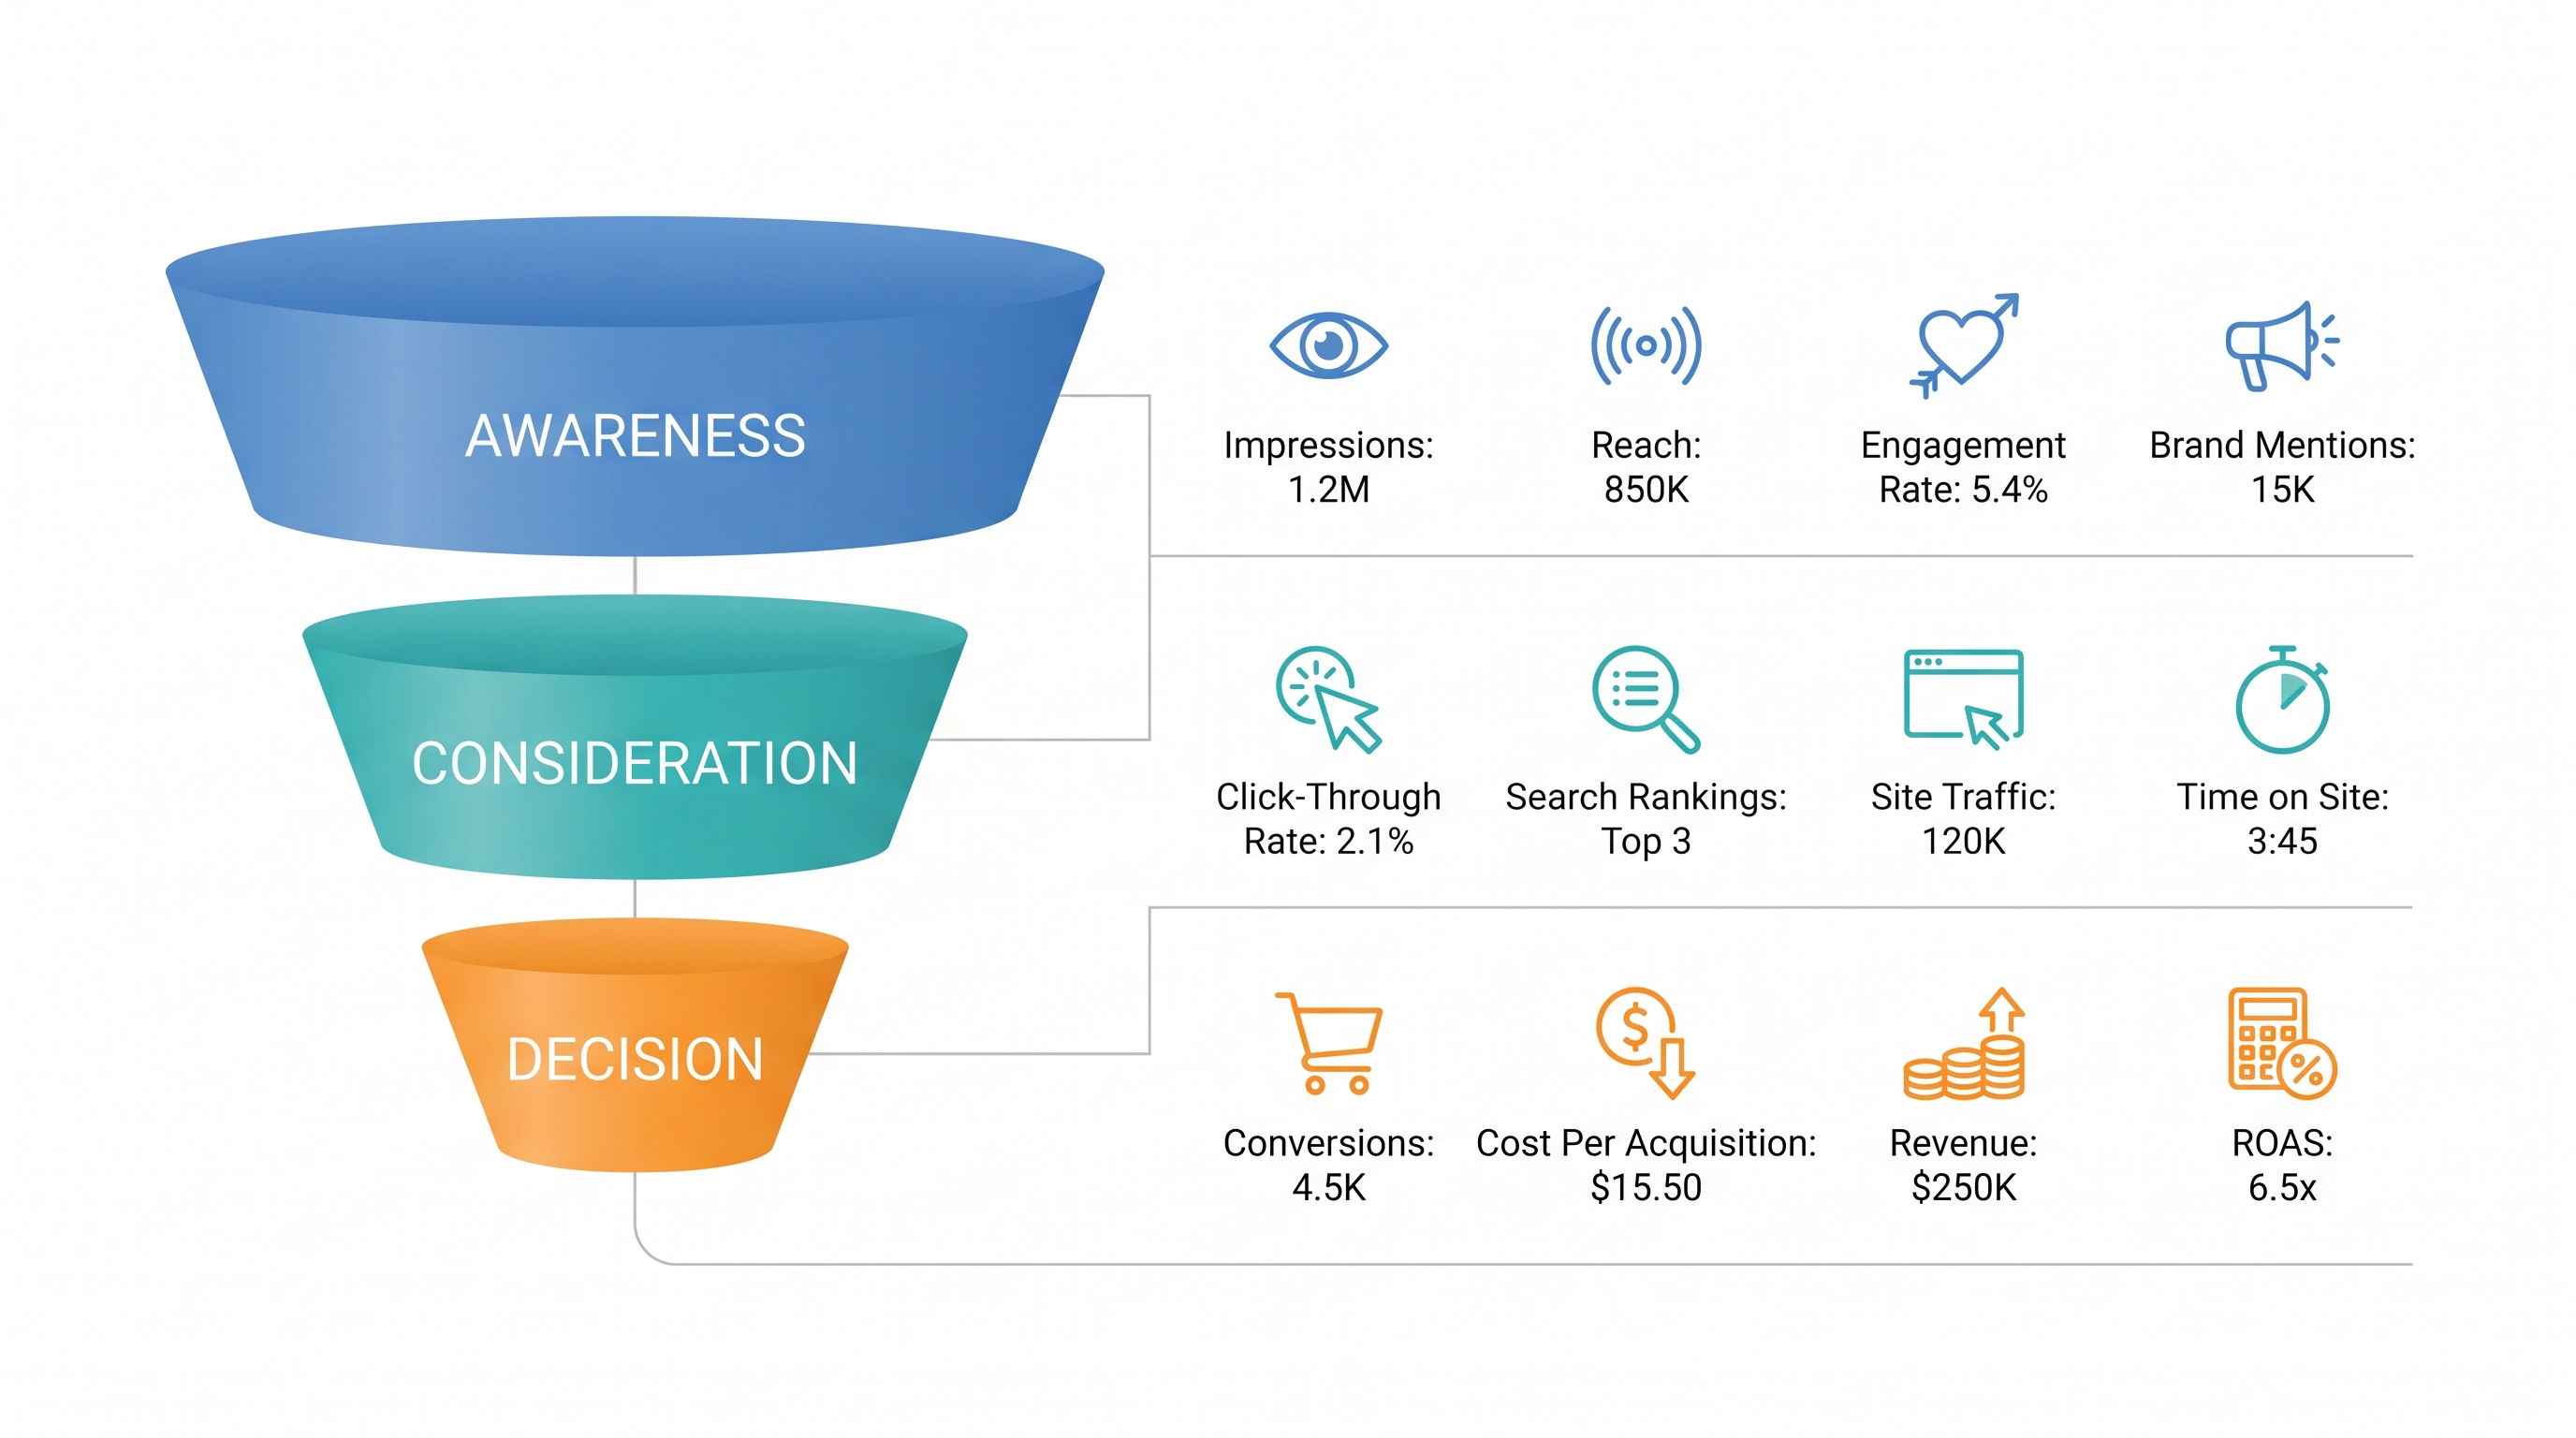
The funnel organizes measurement around business objectives. It does not prove that individual buyers move through each stage in order, or that an awareness campaign caused a later sale. Use the framework to choose questions, then examine the data and attribution limits before drawing conclusions.
A marketing dashboard that’s built to report on campaigns operating on the Awareness level of the marketing funnel will contain top-level metrics demonstrating reach and engagement.
While there’s always room to customize metrics, the goal of measuring Awareness with a dashboard is to quantify audience size, total reach, impact and engagement, and how the brand is perceived.
Since most brands maintain a presence, engage with their audiences, and advertise on social media, a marketing dashboard that quickly summarizes activity and action on social media is a perfect way to measure and report on effectiveness at the Awareness level.
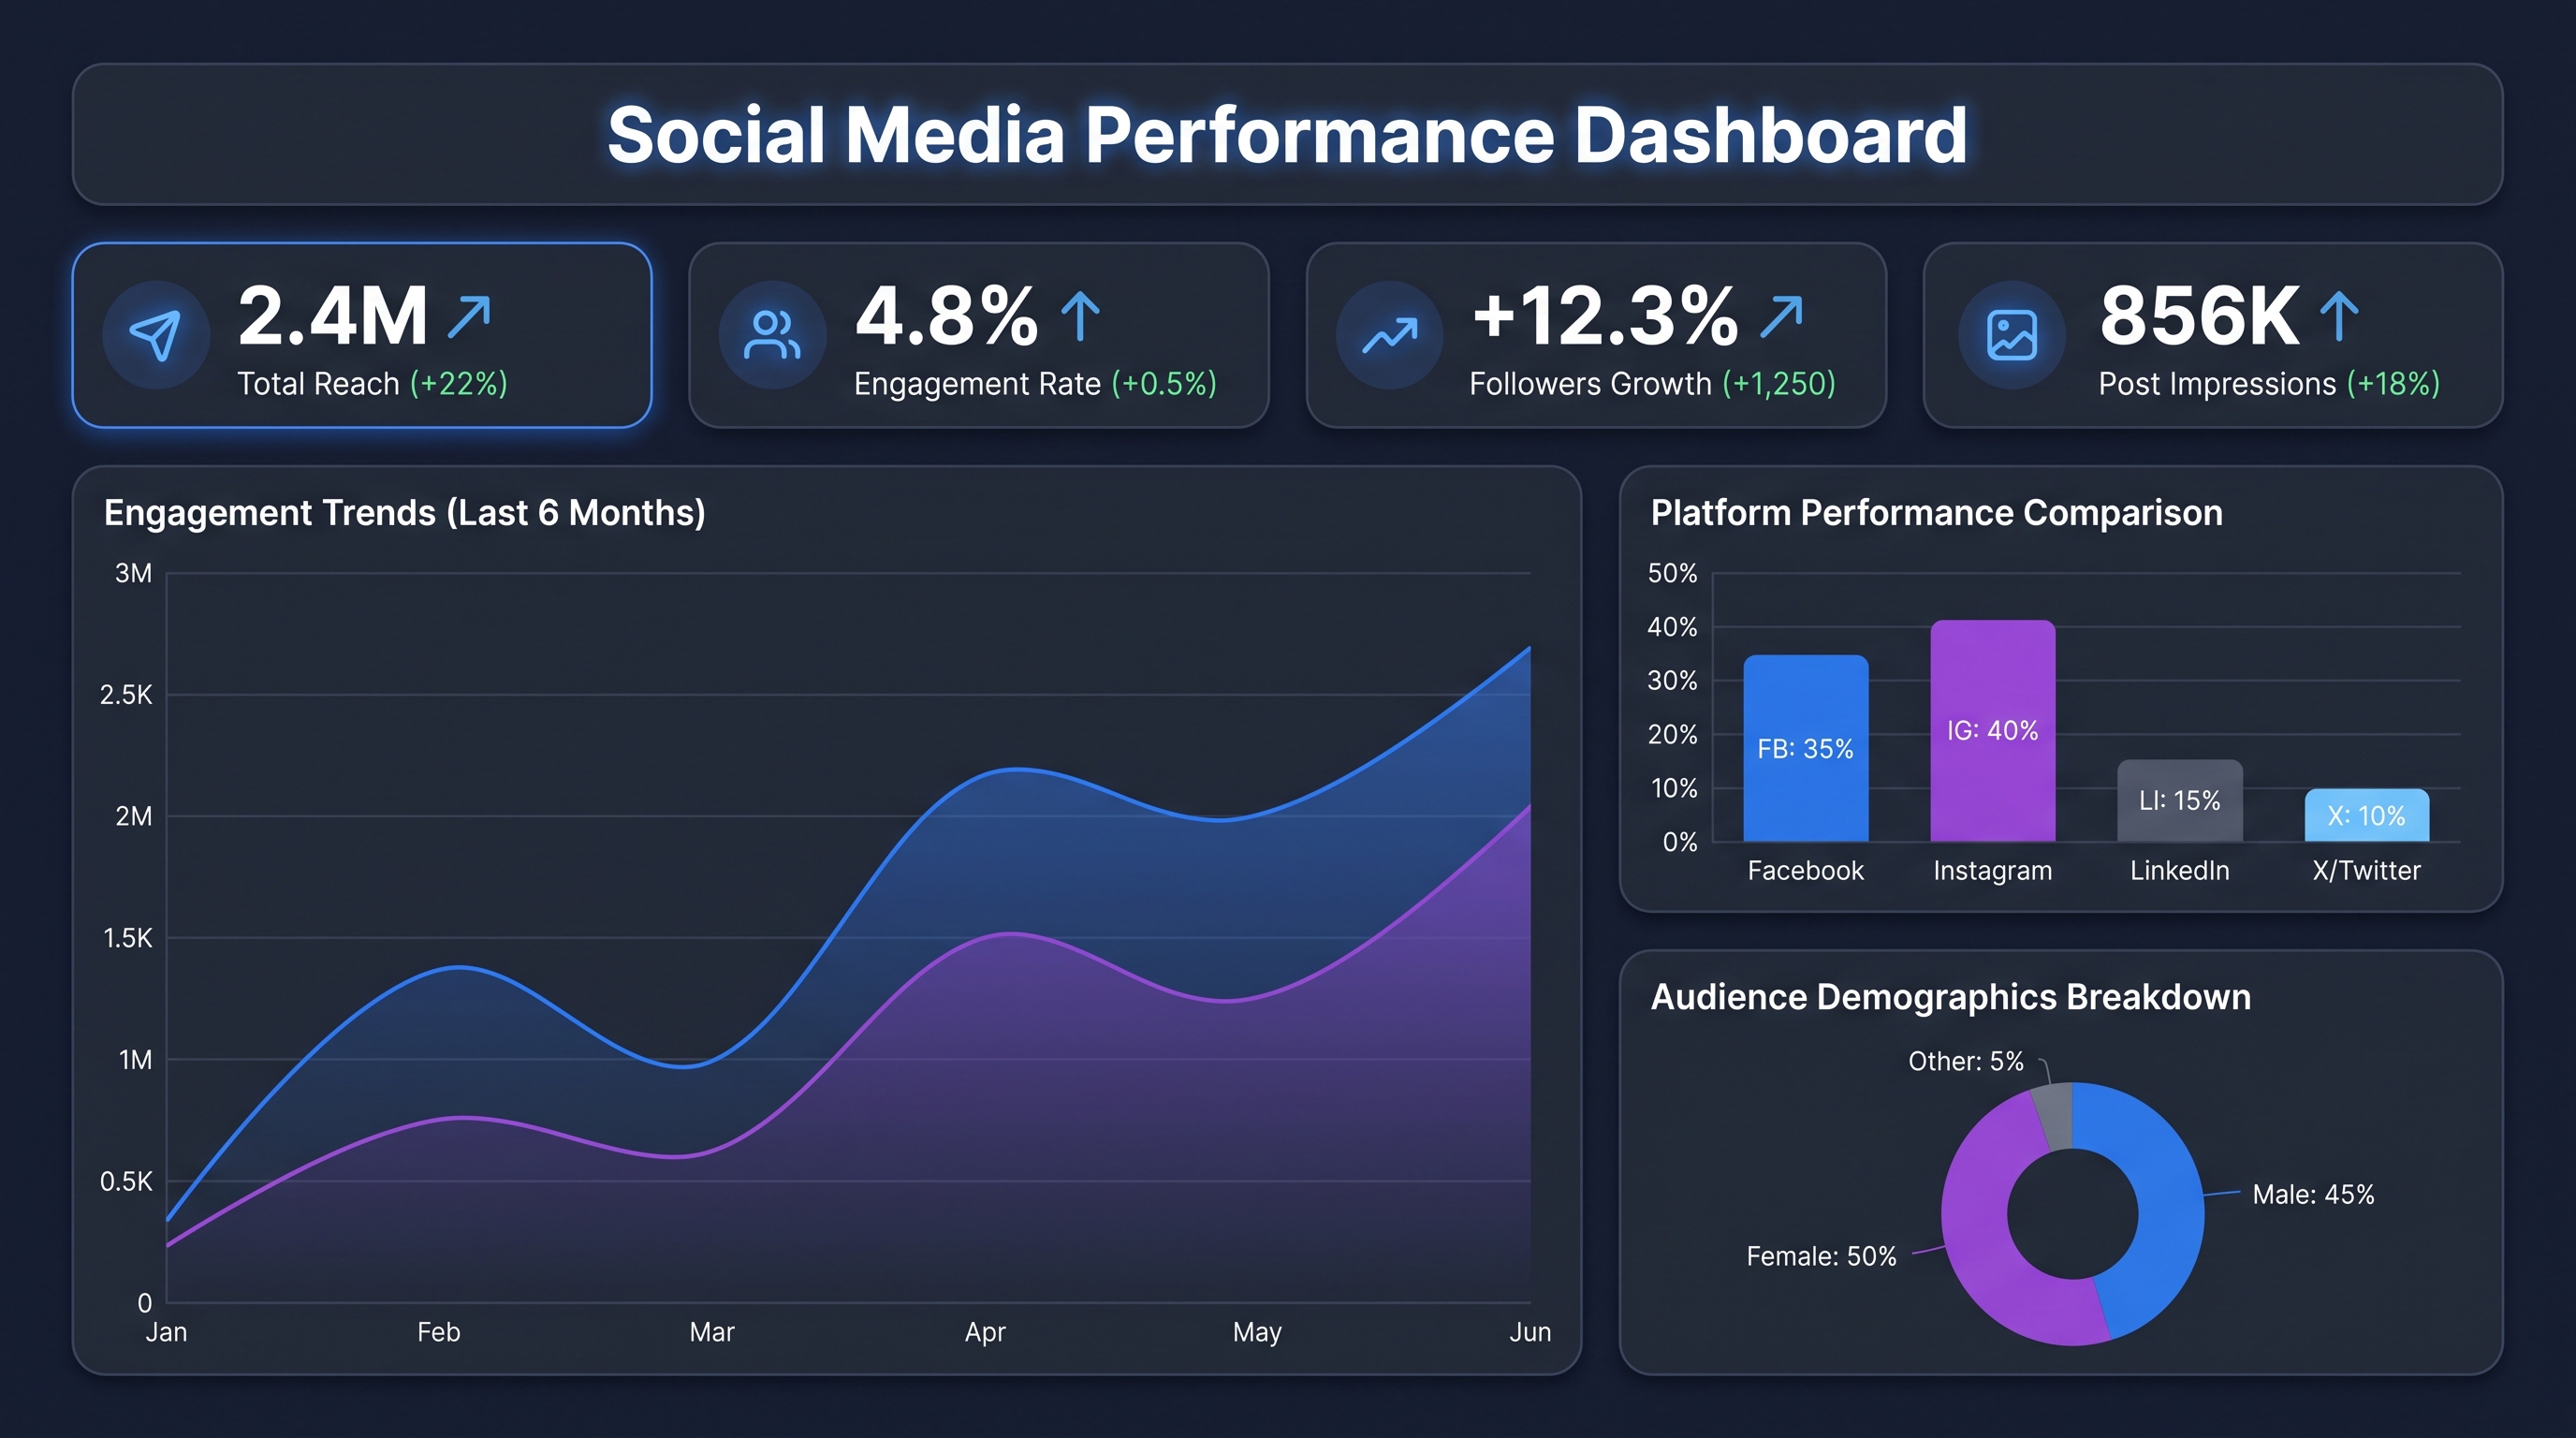
In this social media marketing dashboard example, it’s easy to gain a picture of the overall performance and effectiveness of this brand’s efforts on Facebook. Baselines are established, benchmarks and trendlines noted, and the data is packaged in a presentation format that helps stakeholders understand how their brand is operating at the Awareness level, on social media.
A marketing dashboard that reports on the Consideration level of the marketing funnel, will contain more granular information than top-funnel metrics, drawing attention toward conversion and performance on search engines.
Most consumers turn to search engines for information and guidance on decisions about products and services, that’s why being able to report on your brand’s marketing performance on search is so important to measuring the Consideration stage.
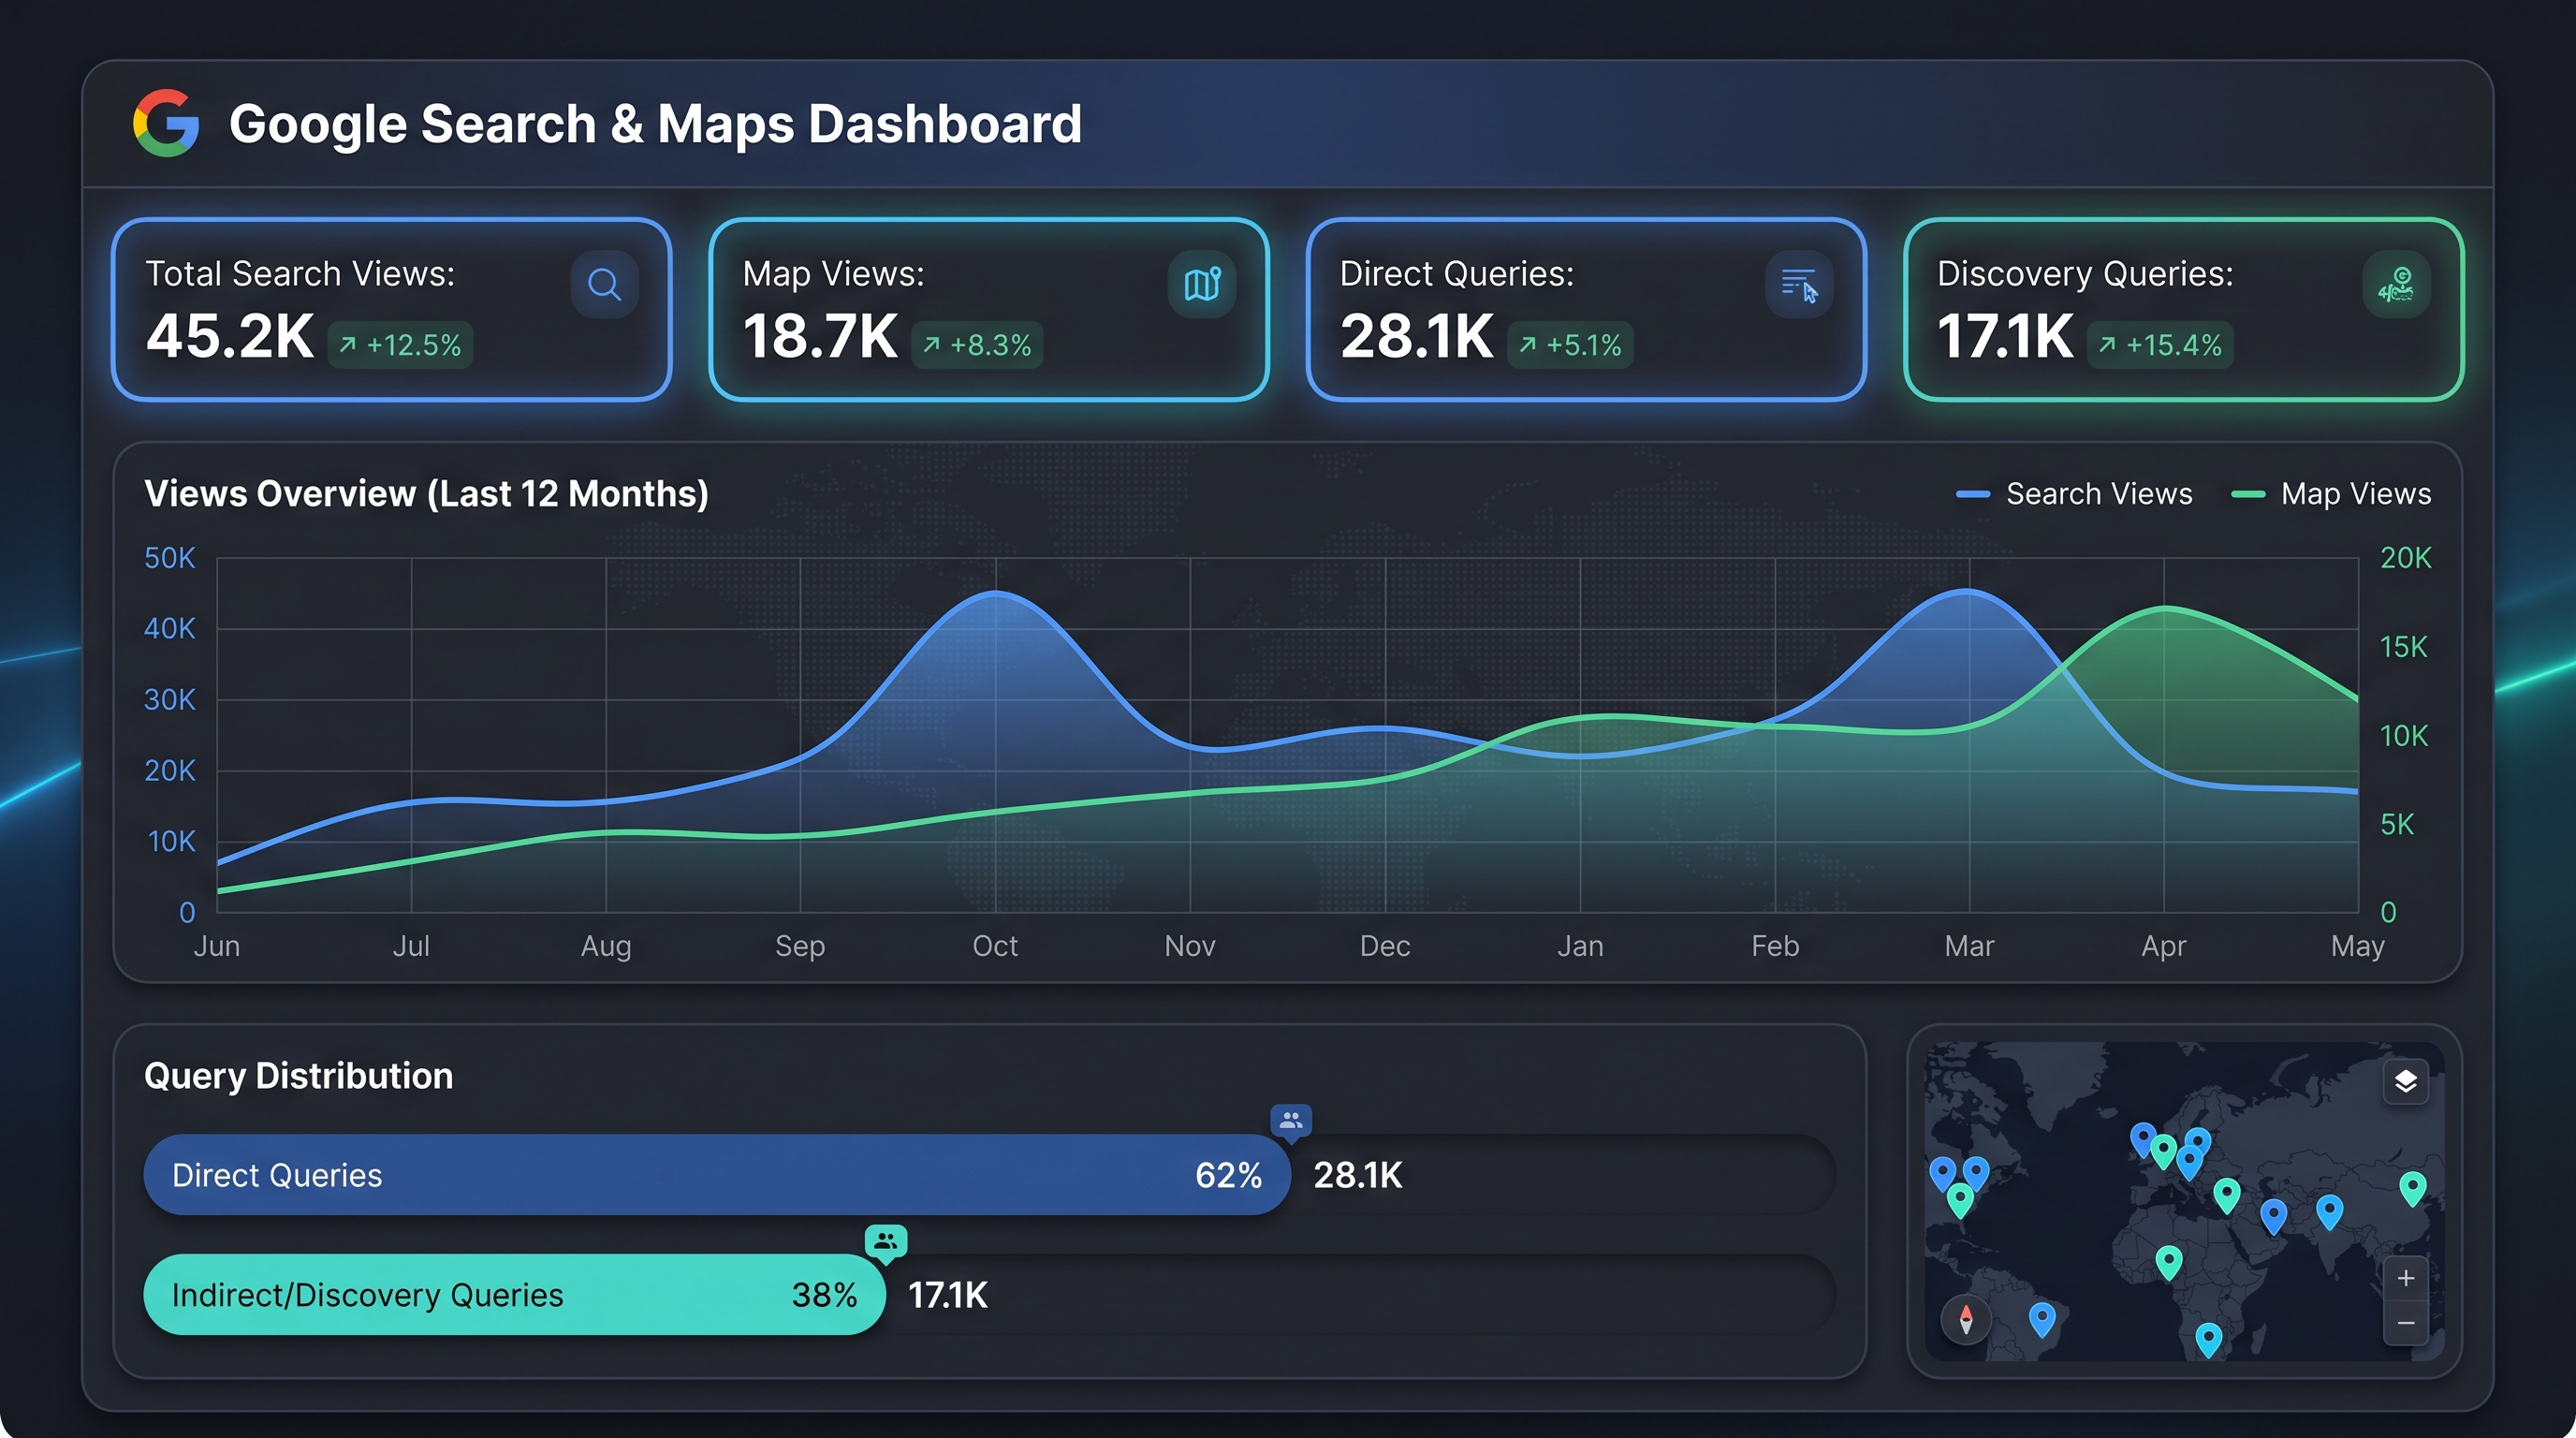
Looking for measurable proof that prospects are moving toward the Consideration part of your funnel, this Google Search and Maps marketing dashboard example, charts Search Views against Map Views, and compares direct and indirect queries, which gives a glimpse into Brand and Category performance.
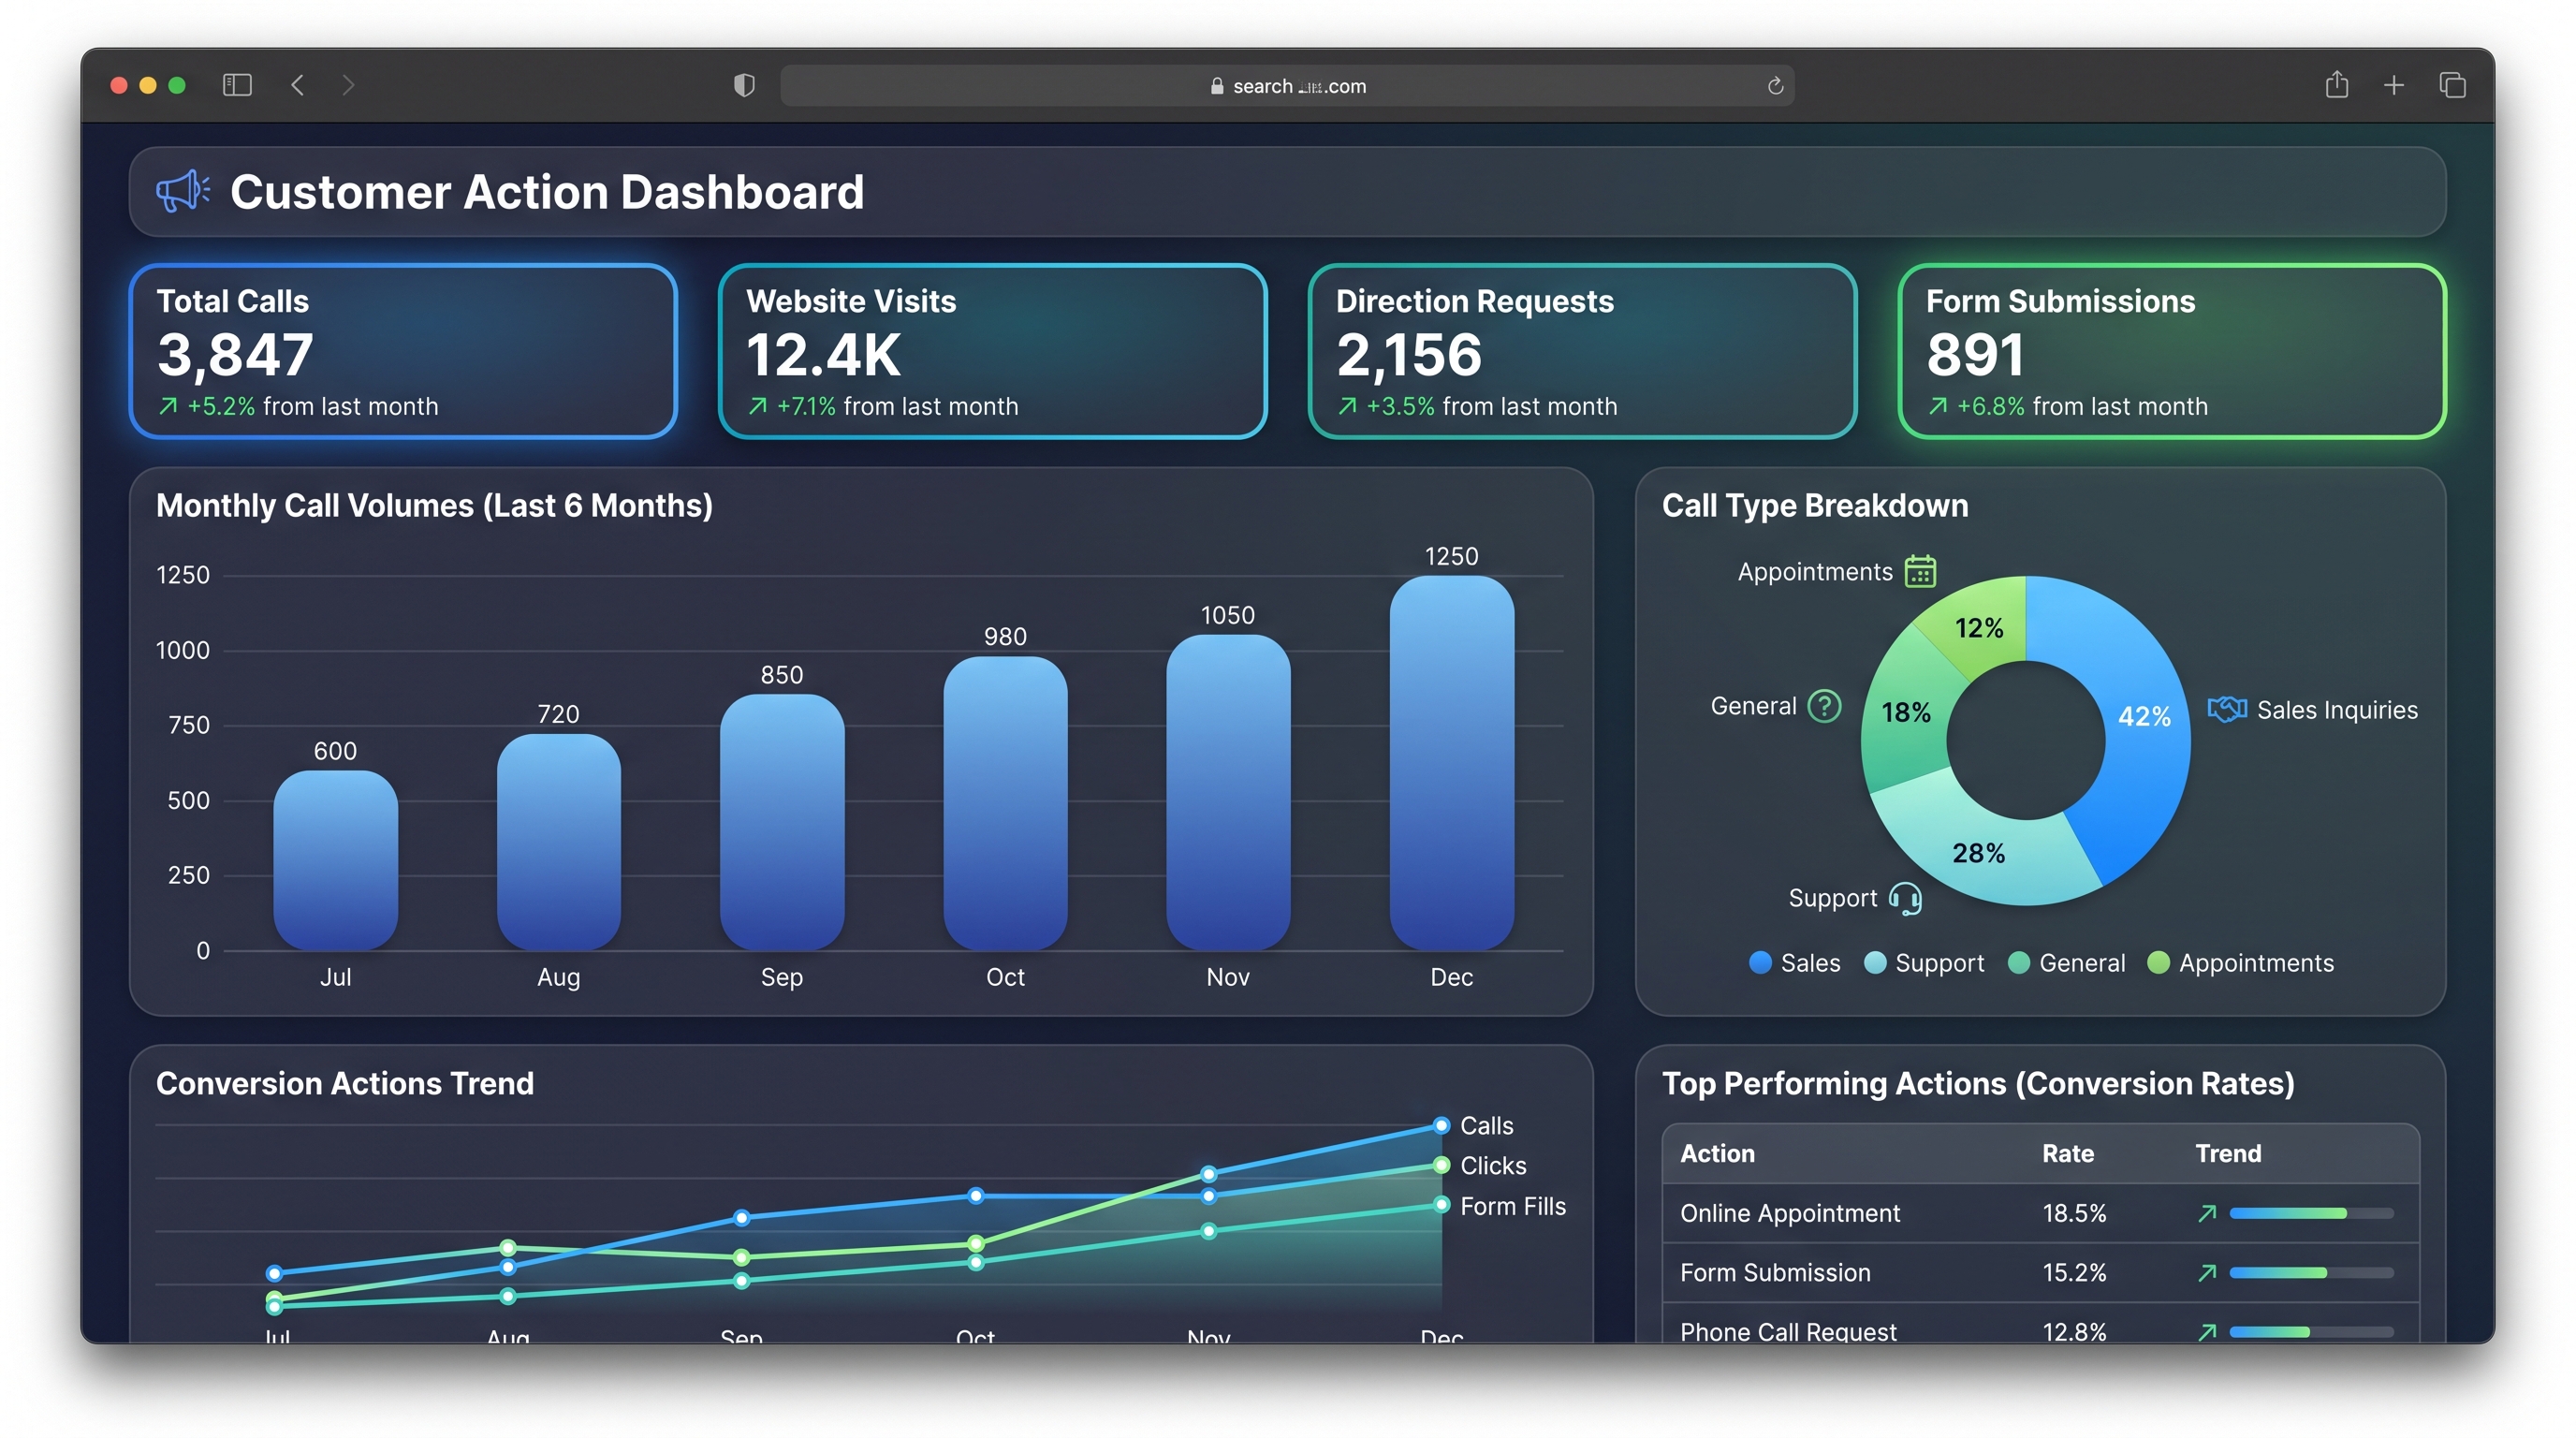
Knowing that stakeholders and marketers alike both prefer metrics that show conversions and actions, this Customer Action marketing dashboard visualizes call volumes, call types, and more activity that help contextualize marketing efforts with measurable outputs.
The Search and Maps screenshot above illustrates an earlier reporting format. When recreating it, use the metrics available in your current data source and check their definitions against Google’s Business Profile performance documentation. Business Profile views measure profile visibility; the Calls metric counts clicks on the call button, which does not establish that a call was answered or became a customer. Connect call tracking and lead outcomes when those are the questions your team needs to answer.
Moving to the final stage of the marketing funnel, a marketing dashboard concerned with measuring and reporting on Decision level campaigns will contain very specific conversion data and insights into ad performance.
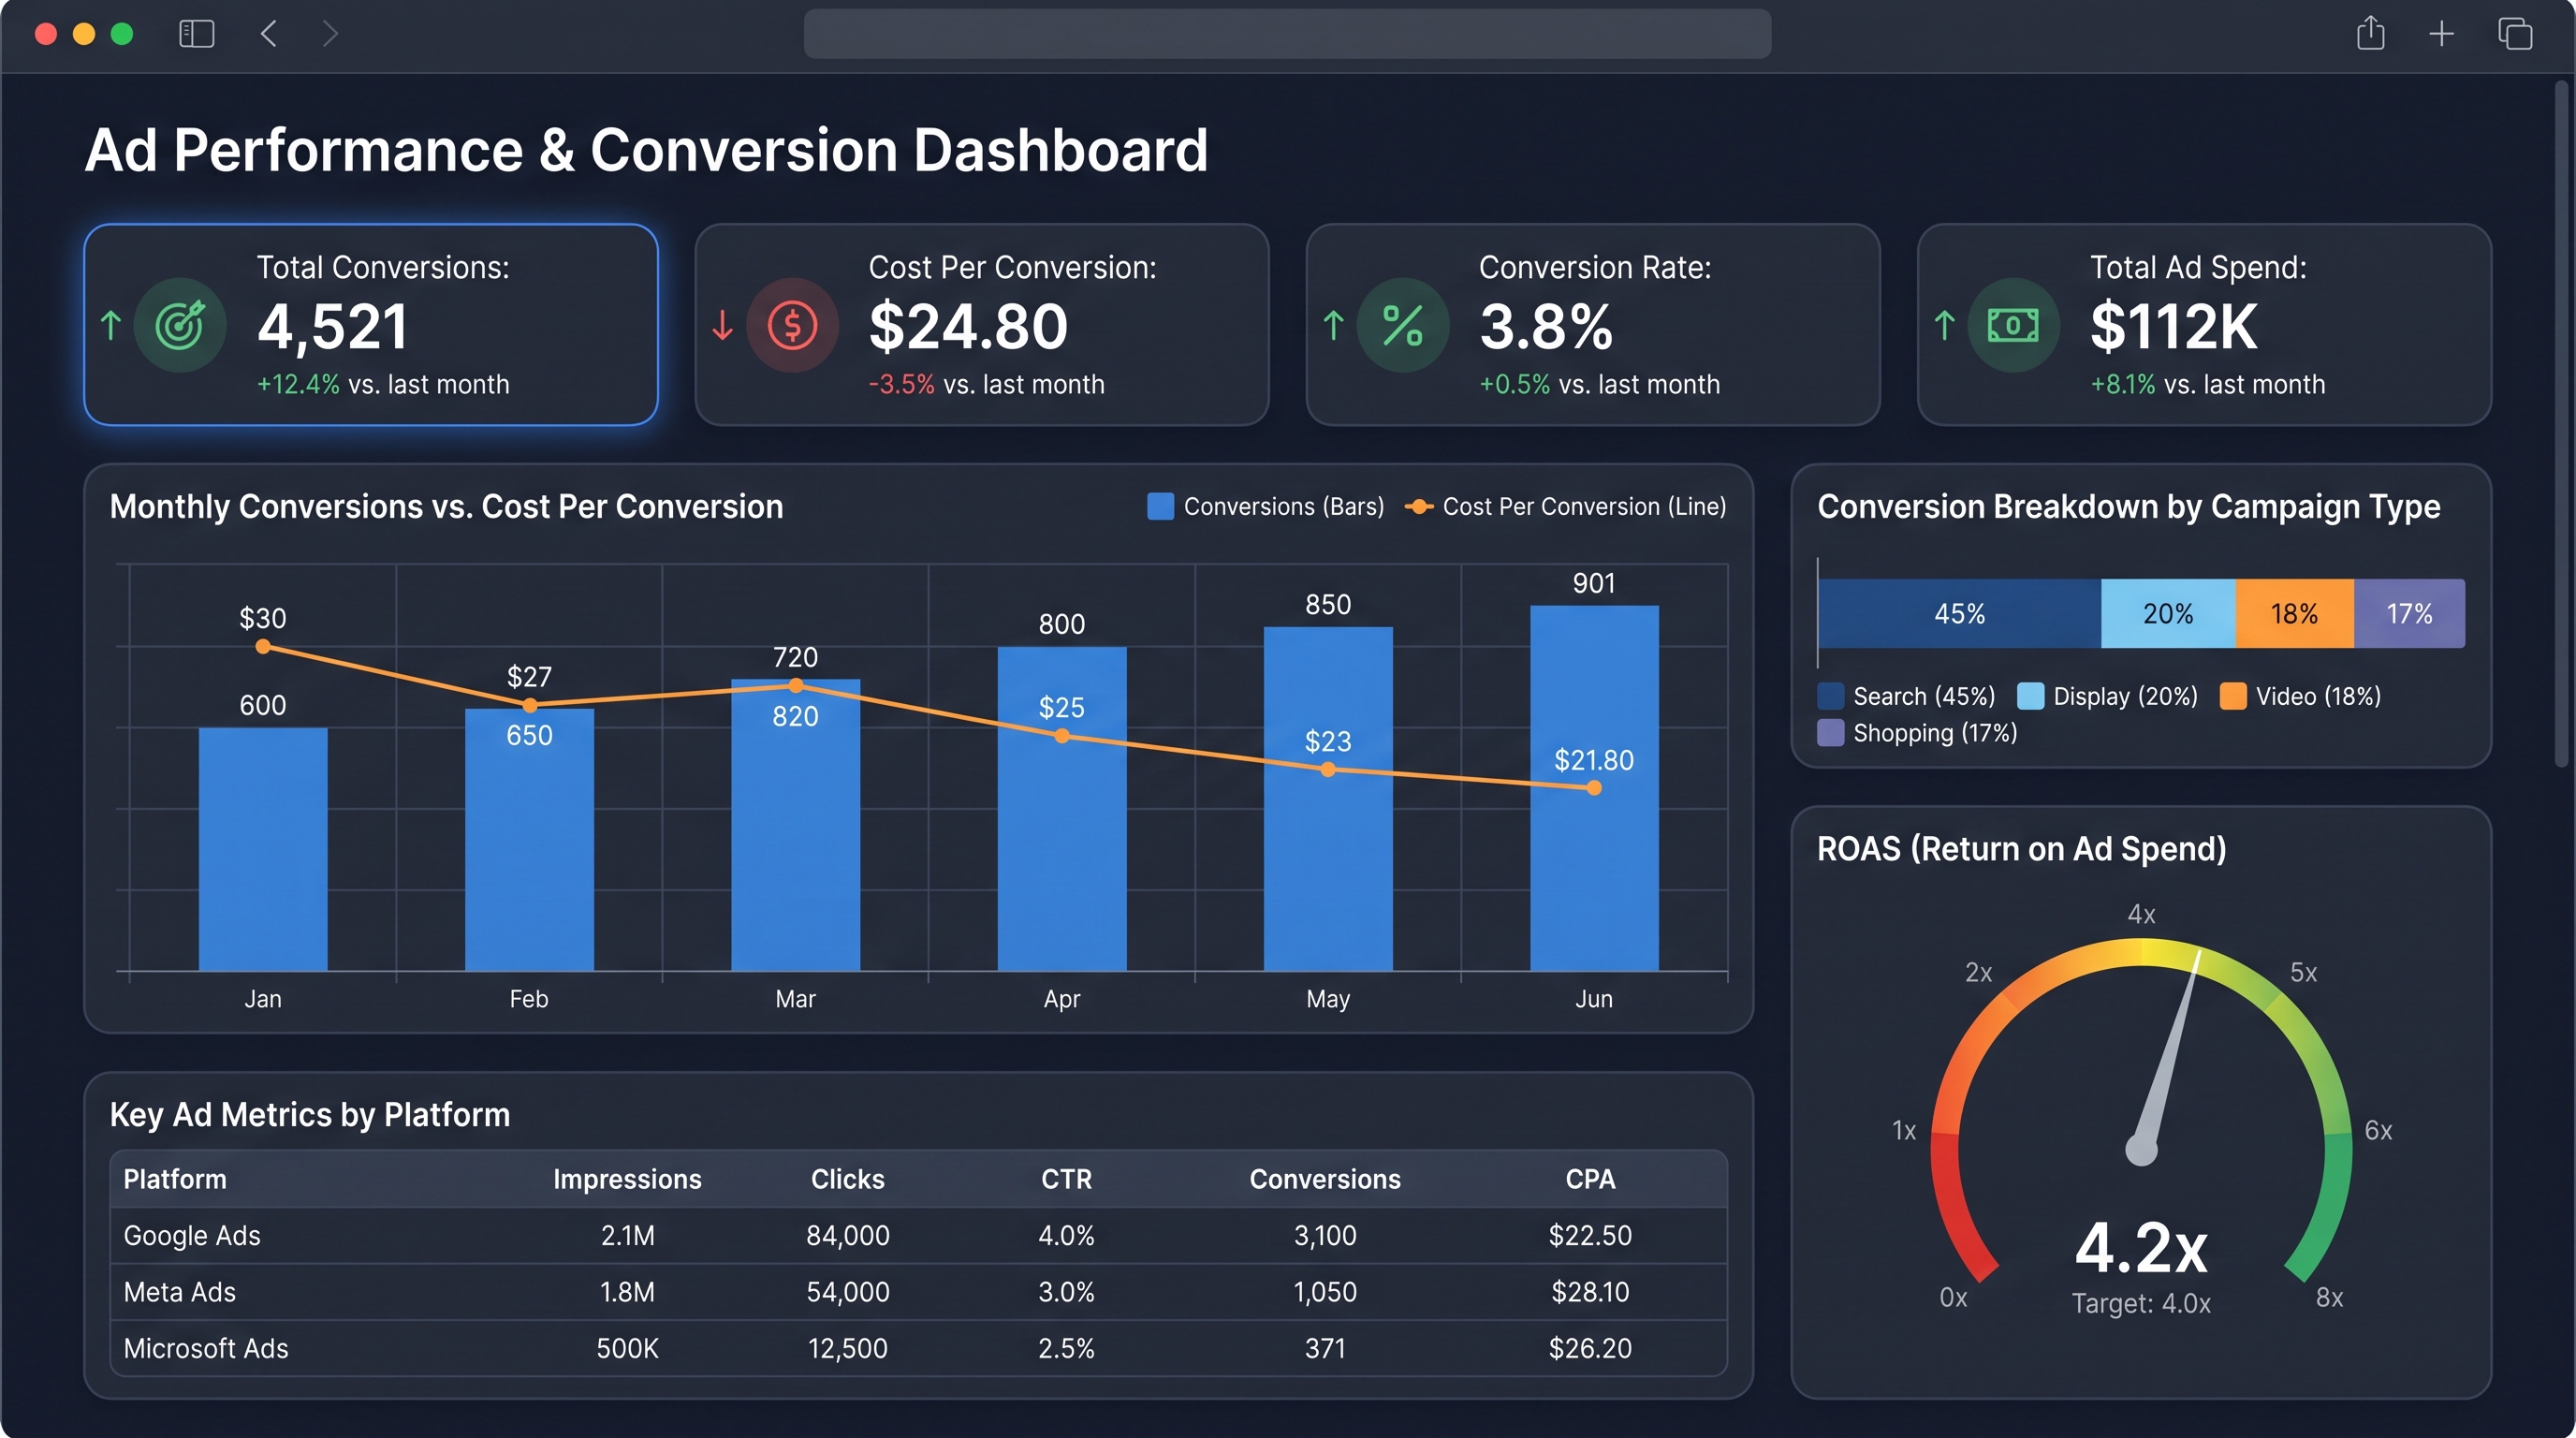
Marketers using most digital advertising platforms will be familiar with the metrics required to prove conversions, but it’s the way in which this data is packaged that will impact its effectiveness. In the above marketing dashboard example, the data required is provided and the baselines and impacts are easy to understand.
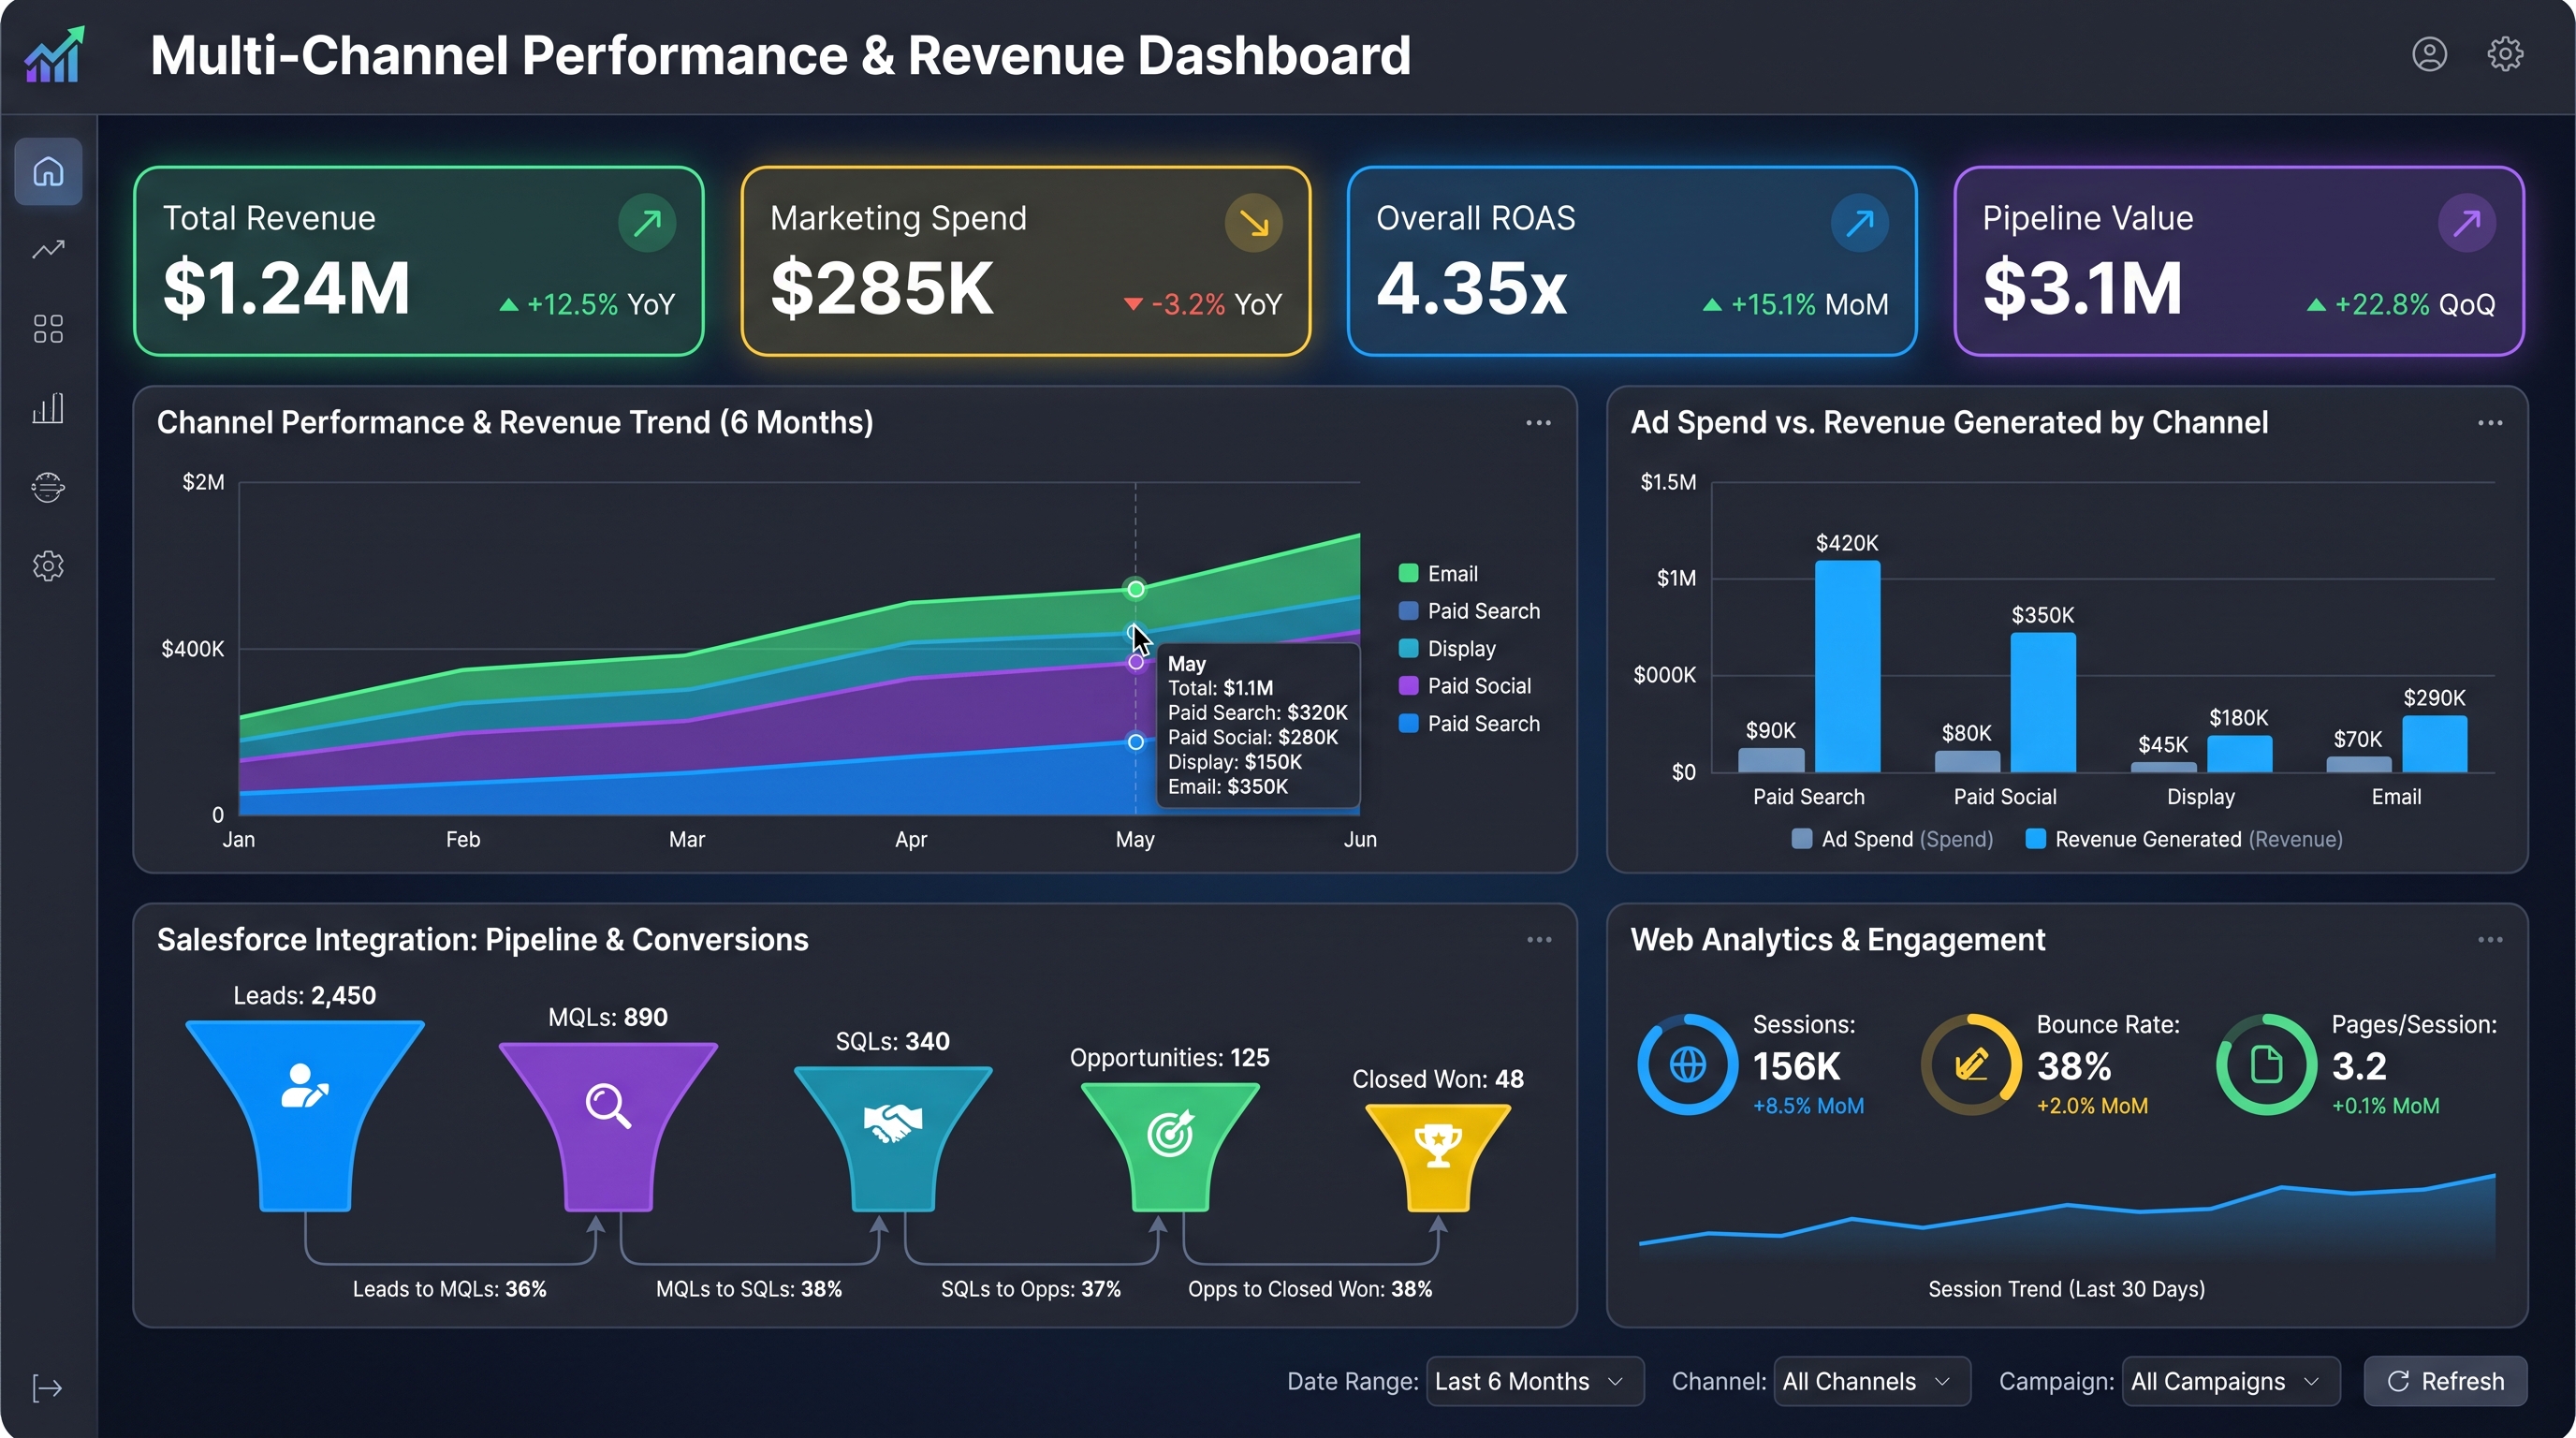
In this marketing performance dashboard example, ad campaign data is placed alongside web analytics and Salesforce data, providing a robust view on marketing metrics. Also, to capture a more holistic view of actual results, this dashboard breaks out campaign performance data by channels and compares it to generated revenue.
A useful marketing dashboard includes the objective, a focused set of KPIs, comparisons, source information, and enough context to support a decision. Before sharing it, check five things:
For enterprise teams managing multiple accounts or locations, preserve the ability to move from an overall trend to the campaigns or locations behind it. Avoid adding platform-reported conversions together without checking for overlap.
During Tim Shea’s conversation on the NinjaCat podcast about making marketing performance dashboards useful, he offers a helpful test, can you explain more than what's on the dashboard? Teams have to be able to identify the specific decision better analysis could change, and the business value of getting that decision right.
"It takes specific work to make your data work as a decision engine instead of a reporting tool," explains Tim. "My goal is to help people rally around their true north metrics and say, 'If what matters is getting the big LTV customers from 120 to 130... let's talk about what marketing is doing to move those numbers. Did the thing that we did last week actually move the needle?'"
Getting your hands on the “right kind” of dashboard isn’t the final destination with marketing performance reporting. By planning reports against the framework of the typical three-stage marketing funnel, marketers can gather the data on a dashboard into packaged reports that illustrate performance across the full spectrum of marketing activities and actions.
NinjaCat's Agent Operating System can help teams monitor connected data, investigate changes, and prepare recommendations between reporting meetings. The team supplies their NinjaCat data cloud with goals, definitions, and business context, then through the platform, reviews the evidence and decides how to respond. Shared data and clear responsibilities matter here, as NinjaCat’s research on AI maturity across the analyze, optimize, and act cycle explains.
Dental Revenue’s marketing team connects marketing activity to practice-management data, helping link ad spend with patient revenue. The team also uses AI agents for recurring search-term review and call analysis. That adds useful investigation around the customer-action and revenue views illustrated above: which inquiries are valuable, and where might the follow-up process need attention?
The way clients experience that work is evolving, too. Our recent blog, Building Your Alpha with AI Agents explores how teams deliver live visualizations and generated presentations through branded data apps. The dashboard becomes part of an ongoing client experience, with the agency’s expertise shaping what people see and how they use it.
A dashboard provides a recurring view of selected metrics. A report packages results for a particular audience and period, usually with interpretation and recommendations. Teams can use the same underlying data for both while adapting the presentation to the decision at hand.
Match the update schedule to the decision and the source’s availability. Daily monitoring may suit spend pacing; pipeline and revenue reporting may require more time for records to mature. Show the latest refresh time so readers know what the numbers represent.
A dashboard can support ROI analysis when it connects reliable cost and financial-return data under clear attribution assumptions. Clicks, leads, or platform-reported ROAS alone do not establish profit or incremental impact. Explain what the calculation includes and what it cannot demonstrate.